What A Portfolio Approach To Climate Policy Means for Your Stock Portfolio
Energy Disrupter
Spread the love
Portfolio theory can lend insights into which carbon abatement strategies policymakers should pursue. If policymakers listen, what will it mean for green investors?
Good Info, Not Enough Analysis
I’ve now read most of my review copy of Investment Opportunities for a Low Carbon World
A Portfolio Approach
The most useful attempt at investment decision-making is buried in the otherwise uninspiring last part of the book. A summary of a 2007 report from the London Accord, A Portfolio Approach to Climate Change Investment and Policy is buried among self-promoting chapters from companies such as Nissan (NSANY)and BP (BP) promoting their (real) investments in clean technology, The report uses a Monte Carlo implementation of Modern Portfolio Theory to determine low-risk mixes (portfolios) of carbon-mitigation strategies, and was written by Professor Michael Mainelli of Z/Yen Group, and James Palmer.
While intended primarily for policy decision-makers, A Portfolio Approach attempts to determine which portfolio of carbon reduction technologies is likely to produce a desired level of climate change at the lowest cost (or highest investment returns) at the lowest risk of failing to achieve the reduction goal. Phrased this way, it is easy to see why portfolio theory is an appropriate tool, since it is designed to minimize systematic (overall) risk even when all individual strategies in the portfolio have significant risks of achieving the expected returns and carbon reductions.
Data
The data on various carbon reduction strategies came mainly from the 2007 IPCC Working Group report, “Mitigation of Climate Change.” This report is not complete, omitting some technologies with significant CO2 reduction potential, in particular solar thermal collectors such as solar hot water heaters and larger installations for process heat in industrial processes. “Solar,” as referred to in the report, refers solely to solar Photovoltaic and Concentrating Solar Power (CSP.)
One decision I found questionable was to ignore the carbon reduction potential of investments with “negative abatement costs on the basis that these investments should be undertaken under any business-as-usual scenario, and are not strictly investment measures as a response to climate change.” (p5/22) This is circular logic. For an investment with negative cot to exist, there must be a market failure. Almost by definition, in a well functioning market, all investments with negative cost will have already been made. Simply saying that these investments “should” be made assumes that these market failures will correct themselves without any effort on the part of policymakers. Why should energy market failures correct themselves in the future if they have not already?
In the authors’ defense, they run one scenario (#3) in which investments with negative abatement costs are allowed, and they state “Further examination of negative abatement proposals seems in order, as it should be important to understand why these investments fail to be made under current financial conditions. Neglected negative abatement may justify regulatory intervention by policymakers, e.g. imposing minimum building or transportation efficiency requirements.” (pp.17/22 and 18/22)
From the hedging in this statement, and the fact that they spend less time discussing scenario 3 than either of their other two, I conclude that something prevents the authors from giving market failures the attention they are due. I find this an extremely common failing among financial practitioners, and believe it is an unfortunate and common consequence of in-depth training in financial modeling. Most financial models contain an assumption of market efficiency, and do not produce meaningful results in cases of large and persistent market inefficiencies. Without tools to model market inefficiencies, practitioners are prone to ignore them, convincing themselves that the inefficiencies are unimportant or will cure themselves. Most of the critiques of “Green Jobs” programs are based on this fallacy.
Put another way, if you have a hammer (a modeling technique which assumes market efficiency, such as modern portfolio theory), you tend to see all problems as if they are nails (efficient markets.)
Results
Since the authors only look at scenarios 1 and 2 (those which ignore negative cost investments) in depth, these are the scenarios I will focus on. I believe the results of these scenarios are still relevant answers to the question, “After negative cost investments in energy efficiency have been made, which positive cost investments should we pursue?” Even if all the necessary carbon reductions could be achieved with negative cost investments, it would most likely be unwise to pursue such an approach to mitigate climate change: like all investments, there is no assurance that the expected reductions/returns will be achieved. Pursuing a wide variety of carbon-reduction strategies provides the greatest chance that some such strategies will achieve the expected reductions, and others will exceed expectations, thus making up for any investments in the mitigation portfolio which do not achieve the expected reductions.
The chart below shows a series of “frontier portfolios”: That is, portfolios of carbon abatement investments which achieve specified levels of carbon abatement at minimal cost. The vertical axis is gigatons (Gt) of equivalent CO2 emissions (CO2e) reduced annually, and the horizontal axis
is the annual investment needed to achieve this level of reduction.

There are diminishing returns for carbon abatement, with the cost of incremental abatement increasing significantly above 15 Gt CO2e per year, and no practical increase in abatement beyond 20 15 Gt CO2e and $400B expenditure per year.
For comparison, to stabilize the atmospheric concentration of CO2 at 350 ppm, a goal which, according to Joe Romm, will require 8 Gt CO2e (approximately portfolio 2) of reduction by 2030, and another 10 Gt CO2e (for a total of 18 Gt CO2e, or portfolio 4) by 2060.  Since the model does not include negative cost investments in energy efficiency or solar thermal collectors, it is likely that these levels of abatement could be achieved at considerably lower cost by incorporating these opportunities.
The pie charts in the first column show the fraction of carbon abatement expected from each investment in the selected frontier portfolios, while the second column shows the cost of each investment. The two columns differ because different investments produce different levels of abatement per dollar of investment. For instance, the cost wedge for Biofuels in portfolios 3 and 4 are much larger than the corresponding abatement wedges. This indicates that abatement with biofuels is more expensive on a per-ton basis than for the other investments in those portfolios.
I will focus on portfolios 2, 3, and 4, since those are the portfolios which deliver the necessary levels of abatement, which we will need to ramp up to over the coming years and decades.
Forestry
The most striking thing about these portfolios is that Forestry dominates CO2 abatement, as well as cost in portfolios 2 and 3. The more aggressive portfolio 4 has three relatively large cost wedges: Building Efficiency, Forestry, and Biofuels.
Unfortunately, according to the report’s authors, the carbon abatement from Forestry is very uncertain. To make matters worse, the methodology used in the report is extremely sensitive to the expected returns (or abatement, in this case) of particular investment classes. Small errors in the expected returns can lead to frontier portfolios which are dominated by a single investment class, in this case Forestry. The report notes that “forestry abatement potential is highly uncertain.” (p.8/22) While we can conclude that forestry is likely to be a significant part of our carbon abatement strategy, there is a good chance that forestry will not dominate the mix as it does in the model.
For stock market investors who want to allocate part of their portfolio to forestry, I recently wrote about investing in forestry stocks and forestry exchange traded funds (ETFs). While I was focusing on the potential for forestry to benefit from biofuels and bio-electricity in the article, any marginal demand for forestry services (including carbon sequestration) should benefit this sector.
Hydropower
Hydropower is also a significant investment in these portfolios. Much of this investment will probably take place in the developing world, but there are also significant opportunities for upgrades to facilities at existing dams in the developed world. I looked at the potential for hydropower stock market investments last year.
Biofuels
Biofuels also contribute significantly to all the portfolios, especially in the higher abatement scenarios, although the costs are high relative to other investments. I don’t believe that this is very realistic if we are also going to have large contributions to carbon abatement from forestry. My guess here is that the authors did not take into account the negative interactions between forestry and biofuels, where an increase in one will drive up the costs of the other because of competing land and water use. Land used for forestry cannot also be used for biofuels, and vice versa.
Wind
We see significant contributions from wind in portfolios 3 and 4, and the costs and potential for wind are much better understood than for many of the other scenarios. Better yet for stock market investors, investments in wind are simple, with two wind energy ETFs allowing a simple investment in the sector. Of the two, I have a slight preference for FAN (you can see my reasoning here.)
Efficiency, in all its Forms
Finally, port folio 4 shows considerable investment in Building Efficiency and Industrial Efficiency (which we usually refer to as just Energy Efficiency), while portfolio 2 has a good slice of Transport efficiency (what we usually call Clean Transportation.) Keep in mind that these slices are only investments that do not have “negative cost,” that is they do not cost less than new investments in conventional generation. Since efficiency dominates investments with negative cost, the total investments in all forms of efficiency are likely to be many times what we see in these graphs. While there is not yet an energy efficiency ETF available, there is one focused on clean transportation, the Global Progressive Transport ETF (PTRP). I also have a few stock picks in clean transport.
For industrial and building efficiency, there is no ETF, but here are five of my favorite efficiency stocks, and you can find a much larger list of energy efficiency stocks here. It’s also important to note that smart grid stocks will fall into this category as well, at least for the purposes of the report. Here are five of my favorite smart grid stocks.
Geothermal
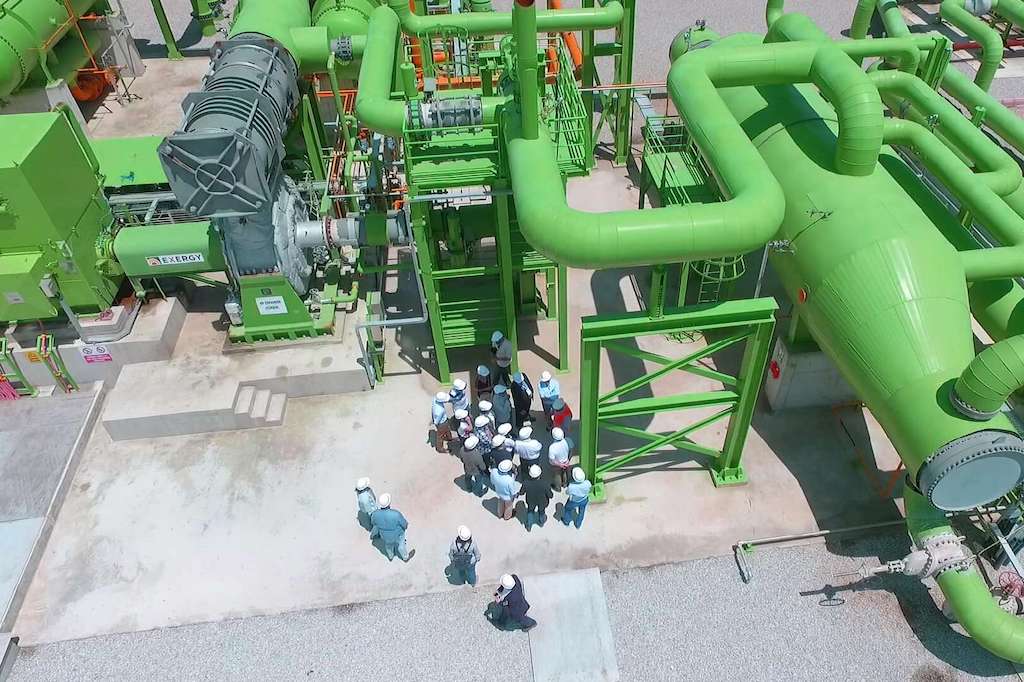
Geothermal also has a small slice of portfolios 2 and 4. This is significant given the small current size of the industry: even these small slices imply rapid growth for an underappreciated sector. I mentioned three geothermal stocks to consider here, but I have since
sold my stake in Raser Technologies (RZ), and will probably not repurchase it. Our Twitter followers saw that first. Charles did a good run-down of the public geothermal stocks in June.
Other Thoughts
It’s also worth looking at what is not in the efficient portfolios, but since this entry is already quite a thesis, I’ll save that for later.
DISCLOSURE: None.
DISCLAIMER: The information and trades provided here and in the comments are for informational purposes only and are not a solicitation to buy or sell any of these securities. Investing involves substantial risk and you should evaluate your own risk levels before you make any investment. Past results are not an indication of future performance. Please take the time to read the full disclaimer here.


