[Article] Seeing the Possibilities with the Water-Energy Nexus
Energy Disrupter
As building performance professionals, we see the world differently than most people. We see the interconnections between west-facing glass and occupant comfort, hidden airflow and insulation performance. Thanks to that ability to see things differently, we are in a unique position to identify and incorporate knowledge others don’t recognize. Today, the concept of the Water-Energy Nexus (WEN) gives us an opportunity to use our vision to influence decisions, programs, and possibly even the sustainability of our world. But while building performance professionals are saying that this makes sense, industry professionals in fields related to water and energy separately don’t always see the opportunities that the WEN provides. This article describes the things some of our building performance peers are doing locally with the WEN to connect disparate efficiency programs, utilities, and systems.
Not a New Concept
On the surface, the WEN, and the calls to action around it, seem like the latest new issue for building performance professionals to tackle. But the concept isn’t new. In fact, my introduction to the WEN came from an image produced by DOE in 2006 (see Figure 1). The image shows the interconnection of our energy and water systems.

Figure 1. Water and energy are interconnected. (DOE)
What is the WEN? For those who don’t see the world like a building performance professional, the WEN is based on the entirely novel concept that our systems are interconnected. Basically, this concept is the house as a system idea expanded to utilities beyond gas and electricity in the home, and to areas beyond the house itself. For the WEN, we apply this concept of interconnection to the water that we use in our homes and in our daily lives.
Beyond building performance, this concept also ties in nicely to a basic high school economics lesson: We don’t get something for nothing.
But what does that mean? Here’s where you might say, “Look, brother, I have definitely gotten things for free. Heck, I even got a free breakfast last time I stayed in a hotel!” And it’s true that you didn’t pay anything when you got that breakfast. But someone paid for the food, the energy to prepare it, and the staff to serve it. It was not free for the hotel, and you can bet that it wasn’t free for you, either. The cost is built into the nightly rate for the room. And that is the magic of the “free” breakfast, and why we have missed the connection between energy and water for so long. We don’t always directly pay for the energy in the water we use.
Do you want the water at your house instead of in a river, lake, reservoir, or underground? Well, that will require moving the water with a pump, and that takes energy.
Want the water supplied at a usable pressure? That will require controlled pumping, and that takes energy.
Do you want it to be potable water? That will require processing to remove all the dangerous organisms, harmful contaminants, and so on—and that takes energy. In Illinois it takes an average of 2,571 kWh per million gallons of potable water. In California, it can take over 4,600 kWh per million gallons.
Want to be able to release the dirty water you’ve used for showering after you’ve used it, rather than store it in some sort of pool filled with foul water? No surprise here—doing so will require treatment, which takes energy. Depending on where you live, this energy may be double or triple the energy needed to make the water potable and to deliver it to your home.
But this connection goes both ways. Every method of producing and extracting energy that we have requires water. Water for fracking. Water for hydropower. Water for producing PV panels. Water for producing biofuel. You name it—it takes water, water, water. Of course, the amount of water needed depends on the type of energy and how we produce it. So for simplicity’s sake, let’s focus on electricity.
Water to Produce Electricity
In the United States, it takes approximately 2 gallons of water to produce 1 kWh of electricity. Again, the consumption varies considerably, from approximately 0.5 gallons/kWh for thermoelectric production to 18 gallons/kWh for “renewable” hydroelectric production. Keep in mind that these figures do not necessarily include the water consumed outside the production facility, and that as utility portfolios have added more PV and wind power generation, the numbers for the portfolio as a whole have changed. Regardless of the specific numbers, the basic concept remains true. Water requires energy, and energy requires water.
Looking back at Figure 1, this seems obvious. The pumping and water treatment facilities are consuming energy from the grid to accomplish what we want. Meanwhile the thermoelectric generation plant and hydroelectric dam are evaporating water into the air. This interplay is the WEN.
In the real world, the WEN describes the connection between energy and water systems, and by extension, the water costs incurred in energy production and use, as well as the energy costs embodied by water treatment and transport. When homeowners turn on the water at their tap, they may be conscientious about not leaving it running while they brush their teeth; they may have a low-flow aerator in place; and they may even go so far as to try to capture the structural waste that runs off before their shower to reuse in their garden. (Structural water waste is the unused water lost while waiting for hot water to arrive at the tap.) Few people think about how much energy went into getting the water to the tap, or the energy and additional water that will be required to treat the water once it’s been added back into the public water system. Even fewer people think of water expenses when they turn on a lamp or an appliance. But as I have explained, every form of electrical production requires some amount of water.
New Mexico, California, and Illinois Take Up the Challenge
Thirteen years after DOE published its groundbreaking report Energy Demands on Water Resources, the WEN appears to have been largely ignored. When the report came out in 2006, the housing market was booming, and many of us in energy efficiency had plenty of other things to focus on, like poorly performing existing and new construction. It wasn’t until a decade later that we started to understand the true value of water.
In the first half of 2015, the drought footprint covered nearly 40% of the contiguous United States. Following a series of dry years, an unseasonably warm winter had resulted in minimal snowfall in the western states. As a result, over 60% of the western United States was designated as experiencing moderate to extreme drought conditions. The proverbial well was running dry. Leave it to a crisis to spurn action, as tens of millions of North Americans worried about their water supply.
From the Midwest to the Pacific Coast, municipalities and state governments started to take action to protect their water supplies. Meanwhile, in the Southwest, some unlikely players were also taking action on this front, but for very different reasons. Typically, building code changes are met with consternation in the home-building community. However, in the high-desert mesas of Santa Fe, New Mexico (The City Different), an unusual scenario was playing out. Following the successful integration of HERS index restrictions in 2009, the Santa Fe Area Homebuilders Association (SFHBA) was championing new code requirements, specifically water efficiency requirements and a scoring system for new and existing residential construction.
Santa Fe
The Water Efficiency Rating Score (WERS) was developed by the SFHBA in association with the Green Builders Coalition as a means to quantify a home’s water use in much the same way as the HERS index quantifies energy consumption. One might immediately ask why. Why would home builders willingly create restrictions on their own industry, particularly ones that might drive up the cost of construction? Well, with their climate’s inherently limited local water supplies, Santa Fe’s home builders saw a threat to their livelihoods. The contractors recognized that no more water equaled no new homes.
Santa Fe and many cities like it have a water budget. This budget sets a limit on the amount of water that the city can draw from available sources. The Rio Grande does not exist solely to fulfill the needs of the 70,000 residents of Santa Fe. No, that resource serves millions of people and businesses throughout the Albuquerque metro area, farmers in the central Rio Grande Valley, El Paso, and even Mexico. Cities in other areas have water budgets, too. Go to Lake Michigan and you’ll find that Chicago also has a water budget. There’s only so much freshwater to support the population and industry in a given area. After that, everything grinds to a halt. For Santa Fe and SFHBA, the solution was clear. Less water needed in new and existing homes meant more water to support additional expansion.
Beginning in March 2017, all newly built single-family homes in the city of Santa Fe were required to have a verified WERS score of 70 or lower (on a performance-based scale of 0–100) in order to receive occupancy certificates. This means that today, on average, all new homes in Santa Fe use 30% less municipal water than homes of the same size elsewhere in the United States. This sits alongside the county of Santa Fe’s HERS 70 requirement, which dates back to 2009. As a final nod to the integration of water efficiency in building performance, the state of New Mexico added WERS into its rules of compliance for the state’s sustainable-building tax credit in 2017 as well.
An important component of WERS is that verifiers must look at water use both inside and outside the home and must calculate a home’s potential water savings (in gallons) were rainwater- and graywater capture utilized. As a result, WERS encourages both home builders and landscapers to look on the front end for ways to decrease a home’s water and energy usage, particularly whenever passive systems can be installed.
Within the water-conscious community of Santa Fe, where any form of precipitation is celebrated, the WERS restrictions have largely been embraced. “Water conservation and efficiency is arguably more critical to our environment than energy efficiency,” asserts Steve Vollstedt, of HERS-NM, LLC, the first WERS verifier accredited in the new program. “We can create electrical energy with cost-effective, clean energy-producing systems, such as photovoltaics and wind generators. There is no practical or cost-effective way to produce or replace water resources that we are rapidly depleting and polluting.”
Since a maximum WERS requirement for residential new construction was included in the building code, Santa Fe has actively and effectively managed its water budget and supported new growth in both housing and industry. In fact, so many homes have easily fallen below the WERS 70 mark, that the city is looking at adding multifamily construction into the code, and to lowering the single-family threshold in 2020.
California
Flash forward just a little and California comes to the forefront, this time with something groundbreaking. California Water-Energy Cost Effectiveness Calculator (see Figure 2) is a codified method for actually calculating the energy embodied in the water in our water systems! It converts the WEN from theory into something applicable. Since the release of the Water-Energy Cost Effectiveness Calculator by the California Public Utility Commission in 2016, things have moved quickly indeed.

Figure 2. The California Water-Energy Calculator calculates the energy embodied in water. (DOE)
Some of our peers in California quickly adopted the calculator for use in specific programs that immediately linked energy efficiency and water efficiency. One notable application is the Pacific Gas & Electric (PG&E) Multifamily Upgrade Program (MUP), implemented by TRC, Incorporated. The MUP team quickly added water-saving measures to the existing portfolio of traditional energy savings retrofits. This was no small task! There were a lot of complications, including just figuring out where the water was coming from in order to be able to calculate its specific embodied energy. To put it into perspective, there are approximately 2,756 water agencies, districts, and departments in California!
The MUP team worked hard to be able to incorporate energy savings from retrofits that were previously believed to save only water. In other words, the team could now count off-site energy savings, since that energy was embodied in the water saved. This may be where the WEN makes its greatest impact—counting energy savings that occur away from the individual energy meter.
Illinois
While California often makes news for innovation, Illinois has been quietly moving forward with some of the possibilities afforded by the WEN. “In March 2012,” according to Water Efficiency Watch: News from the Alliance for Water Efficiency (AWE) “the Illinois Section of AWWA [American Water Works Association] published a survey of water utilities that documented the energy intensity of drinking water and wastewater.” That is the WEN—period. But Illinois has not stopped there. In 2018, the Illinois Commerce Commission approved WEN calculations and values in its statewide Technical Reference Manual for energy efficiency programs. Want more? Again from the AWE newsletter cited above, “Illinois is now the first state in the country to allow . . . reimbursement to water utilities for the energy they save in their water conservation programs . . . [including] embedded energy savings.” While it is not clear what this will mean for Illinois as a whole, ComEd, the electricity provider for the greater Chicago area, has already announced that it is looking into programs to save water.
ComEd, PG&E, and other utilities are looking at ways to use the WEN as a means to collaborate, and to move from simply counting site-realized savings to counting off-site savings.
Why Off-Site Savings Are Important
In the energy efficiency world, program designers, implementers, and evaluators are really good at identifying and counting site savings. Site savings are the energy and resource savings that occur at the specific site that has received retrofits, training, or some other treatment. Counting off-site savings had previously been out of bounds for many energy efficiency programs. If we look at the DOE WEN image again (see Figure 3), we see site savings in the little purple box. Meanwhile huge amounts of energy are consumed in the off-site orange boxes.
In many municipalities, the energy in the orange boxes dwarfs all other municipal energy expenditures combined! The WEN might not save the world, but it does open up new possibilities in the reach of, and in the collaboration among, efficiency programs.
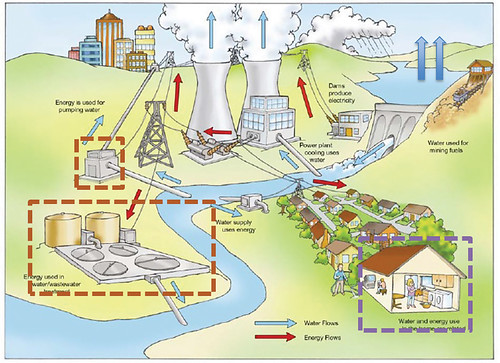
Figure 3. On-site energy savings happen in the purple box, but huge energy is used off site (red boxes). (DOE)
What’s Next?
From here it is not yet clear where program designers and implementers will go with the new possibilities that the WEN and the California Water-Energy Calculator provide. Many states—including Illinois, Wisconsin, Oregon, New York, and Washington—are either adopting water-energy calculations into their statewide technical resource manuals or are at least seriously considering it. One thing is certain: Water is precious. We’ve undervalued it for more than a century. Hopefully we won’t have to wait until the well runs dry before we realize its true value again.


